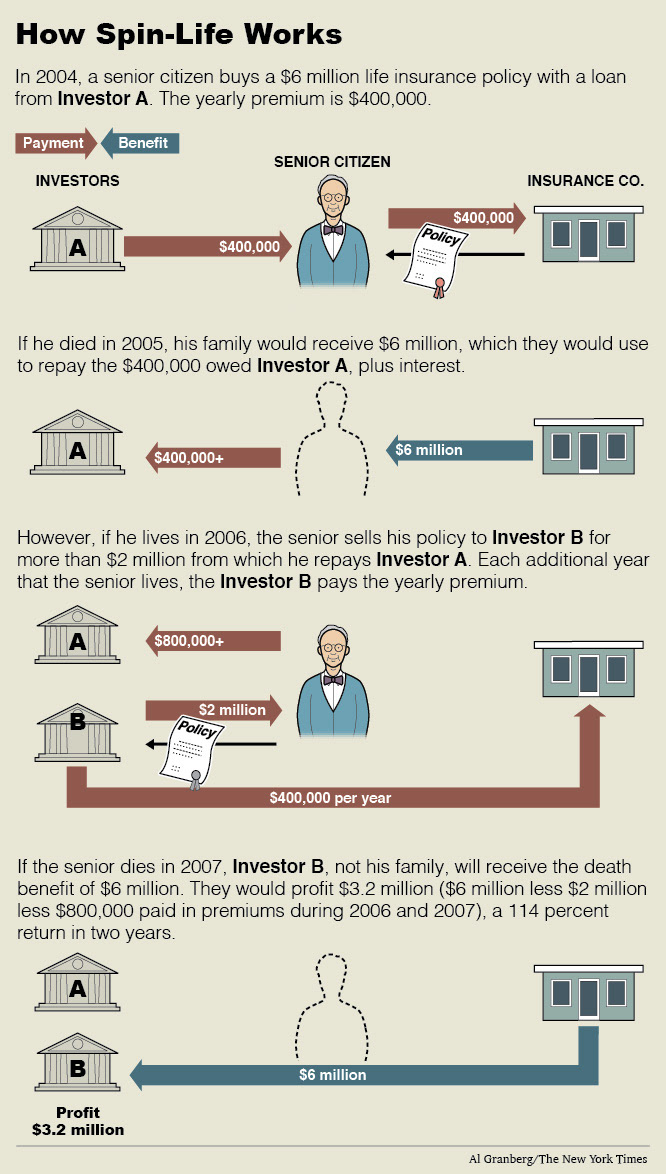
Diagram of how investors collaborate to reap huge benefits from an insurance policy. For The New York Times.
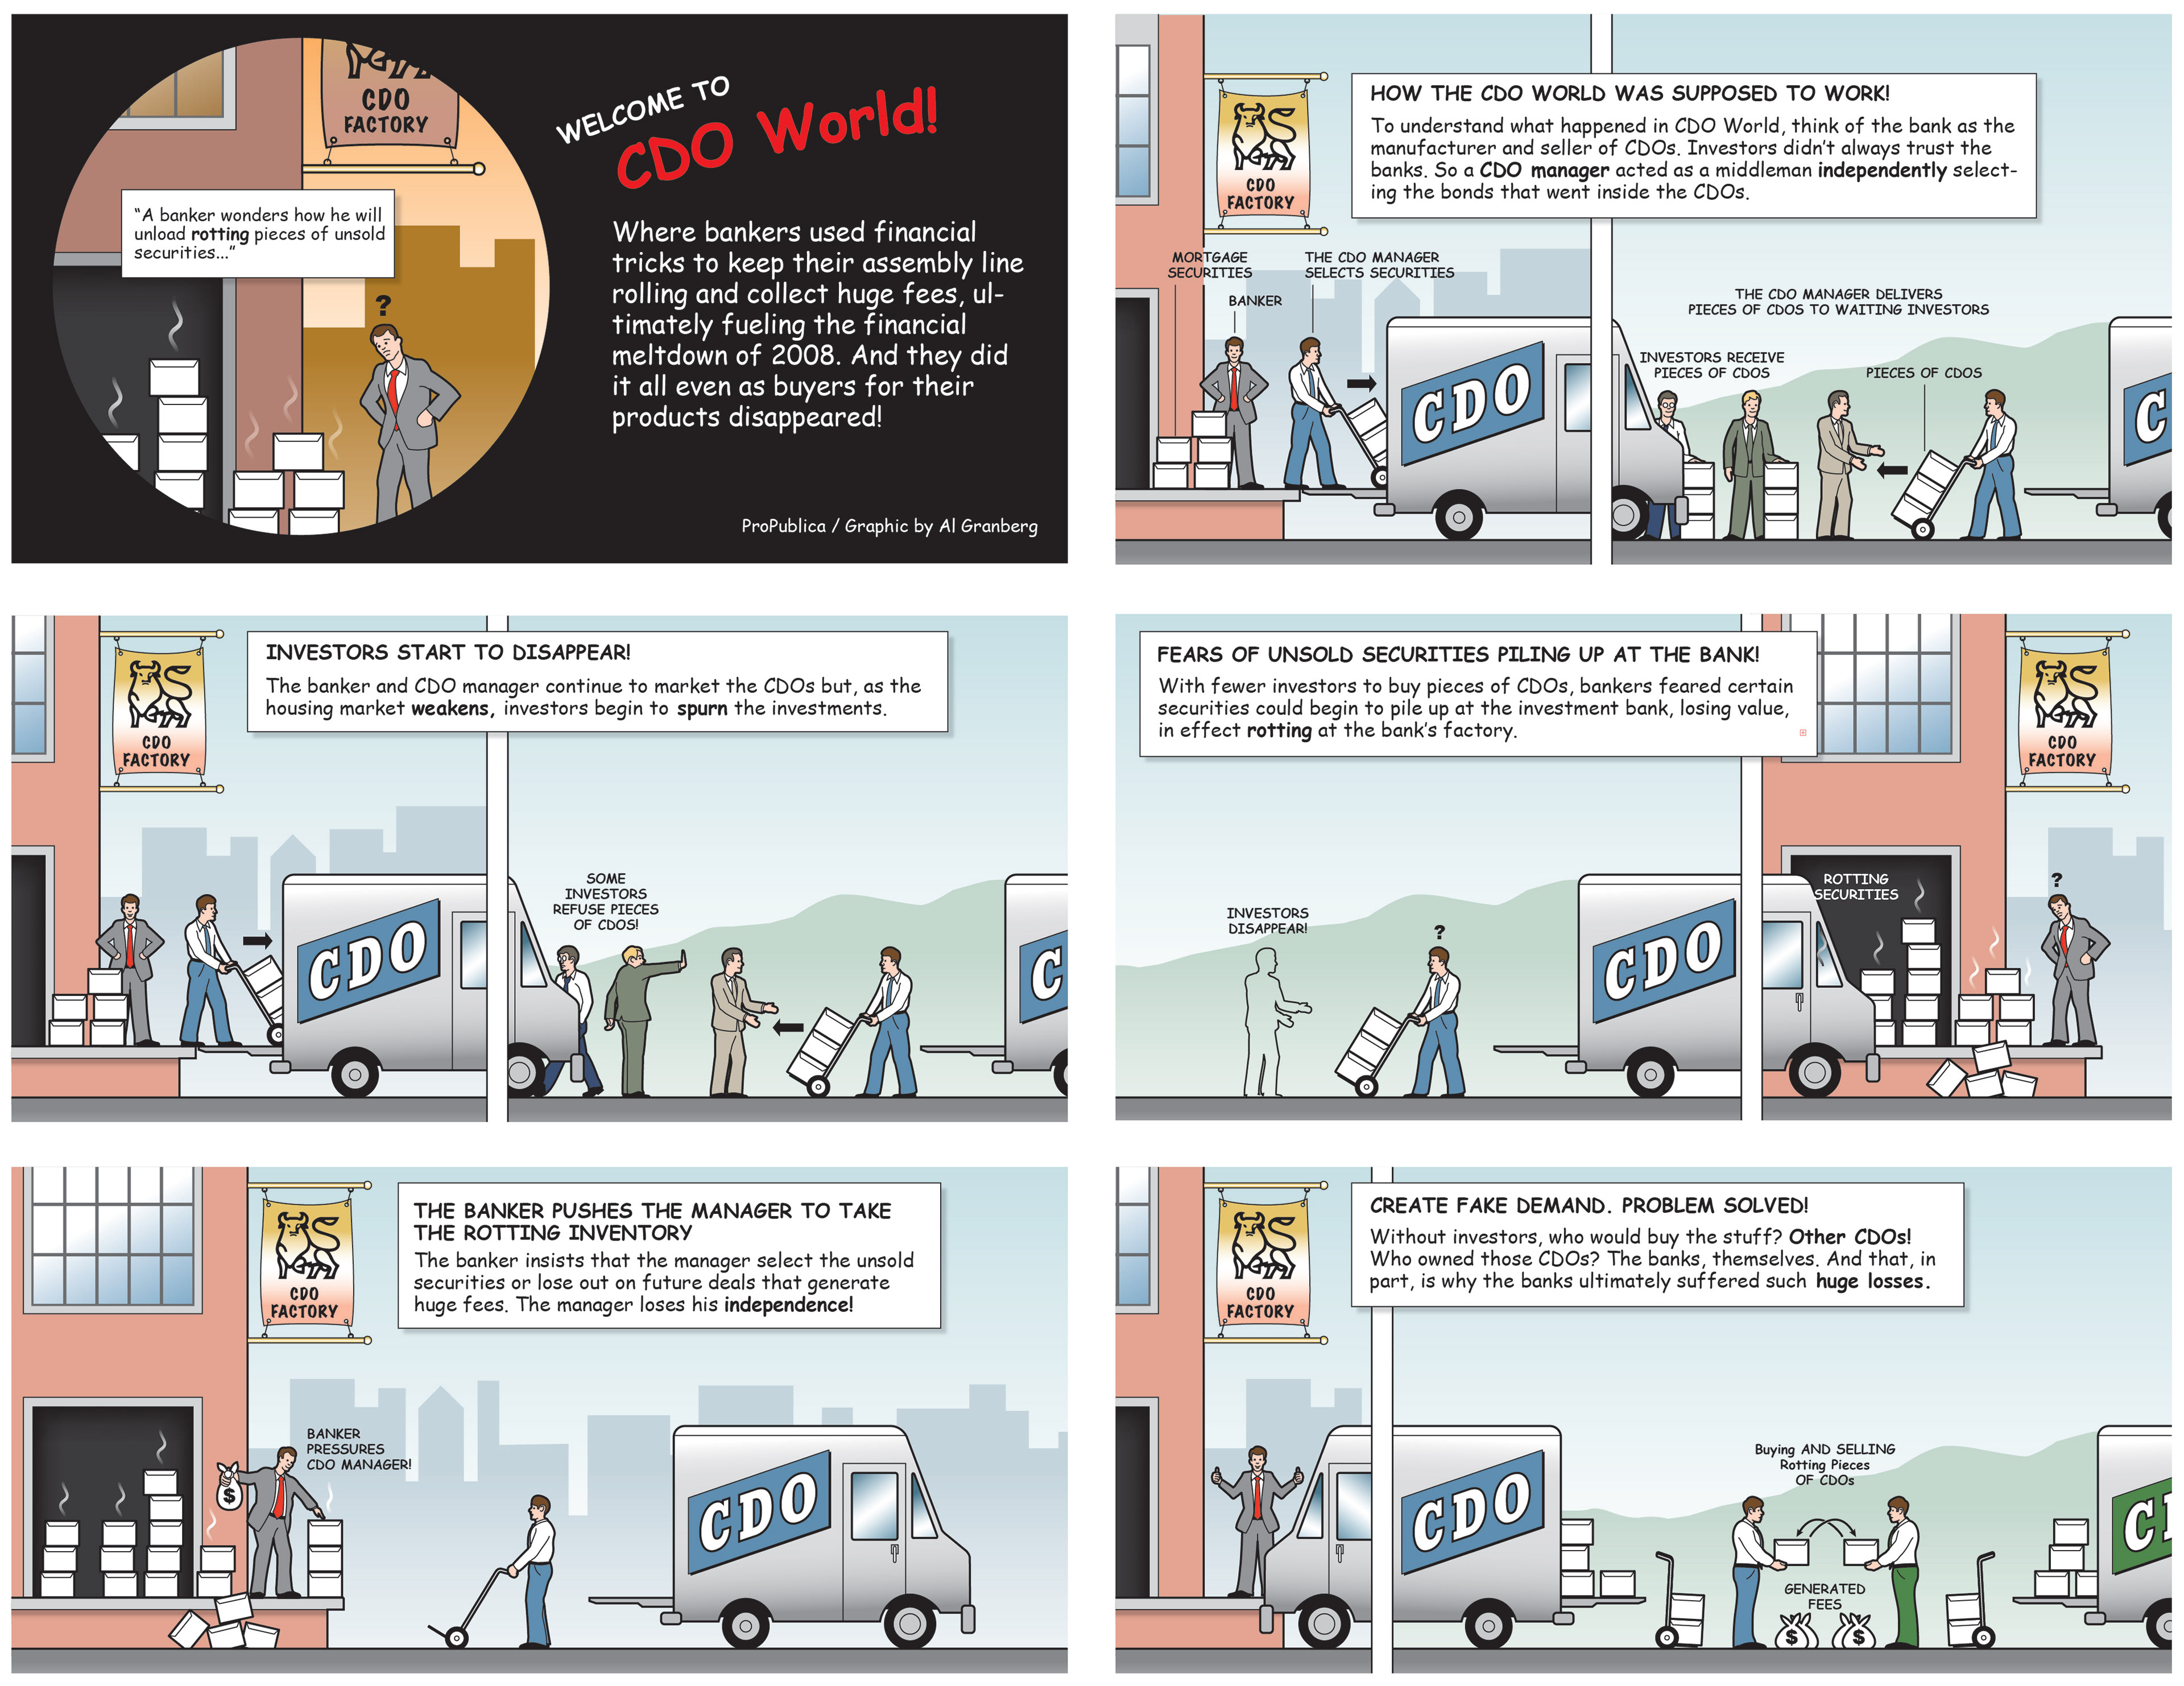
Illustration of how bankers and investment managers sold worthless investments eventually causing the collapse of banks. For ProPublica.